Renewable Modelling · TOV Study — Feeder Fault

TOV Analysis for a Collector-Feeder Fault in EMTP®

Healthy-phase overvoltage, collector earthing and surge-arrester survival

A single-line-to-ground fault inside a renewable collector system can collapse the faulted-phase voltage while raising the healthy phase-to-earth voltages. The study objective is to determine whether the surge arresters can withstand that voltage for the full protection clearing time. This is not mainly a fault-current study — it is a TOV survival study. How far the healthy phases rise is set by the collector-grid earthing, the cable zero-sequence behaviour and the converters’ current limits; whether the arresters survive depends on that overvoltage and on how long the internal protection takes to clear the fault. The physics, the role of earthing and converters, the arrester TOV capability curve and the handling of protection timing follow below.

Reading time ≈ 18 min · SLG fault, earthing & arrester TOV survival

A temporary-overvoltage (TOV) analysis for a fault on a feeder inside the collector system of a wind or PV park is easy to read as a fault-current study, but that misses the point: the dangerous quantity is the overvoltage on the healthy phases, and the real question is whether the surge arresters can survive it for the time the internal protection takes to clear. TOV is a temporary phase-to-earth overvoltage lasting for cycles or longer, and it is assessed differently from fast-front or switching-impulse insulation stresses, because its duration is central. The study pulls together five threads at once — unbalanced-fault behaviour, converter current limits, collector-grid earthing, protection clearing time and surge-arrester survival. The types of overvoltage and temporary-overvoltage sources pages give the wider context.

Abbreviations used on this page
TOVTemporary overvoltage
SLGSingle-line-to-ground (fault)
\(k\)Earth-fault factor
\(\phi\)ePhase-to-earth (voltage)
\(X_0/X_1\)Zero- to positive-sequence reactance ratio
MOSAMetal-oxide surge arrester
\(U_c\)Arrester continuous operating voltage
PCCPoint of common coupling
WPPWind power plant
OCOvercurrent (relay)
EMTElectromagnetic transient
EMTP®Electromagnetic Transients Program
Key idea
  1. A single-line-to-ground fault on a collector feeder collapses the faulted phase but raises the healthy phases above normal. The rise is captured by the earth-fault factor \(k\), which is governed by how the collector grid is earthed.
  2. Converters are not passive here: their sequence and voltage-support behaviour, and especially their current limits, shape the resulting phase voltages. TOV in a park is a network + control + protection problem.
  3. The objective is not the peak voltage but arrester survival: can the surge arresters withstand the overvoltage for the time until the protection clears the fault? TOV is a voltage-and-duration problem.
  4. It is assessed by comparing the simulated voltage–time stress against the arrester’s TOV capability curve — survive if the (magnitude, duration) point stays below it. Clearing time can be a simple equivalent delay or a detailed relay model.
Key terms used on this page
01Temporary overvoltage
A power-frequency overvoltage lasting from cycles to seconds, here during a fault until it clears.
02Single-line-to-ground fault
One phase faulted to earth; collapses that phase and can raise the other two.
03Healthy-phase overvoltage
The rise in phase-to-earth voltage on the unfaulted phases during an earth fault.
04Earth-fault factor
The ratio of the highest healthy-phase voltage to its nominal value; set by the earthing.
05Neutral shift
Displacement of the system neutral during an earth fault, which lifts the healthy phases.
06Zero sequence
The component that flows in an earth fault; its path is decided by the earthing arrangement.
07Collector earthing
How the park’s collector grid is earthed — the dominant factor in the healthy-phase rise.
08Surge arrester
A metal-oxide device limiting overvoltages; it has a finite TOV withstand, not infinite strength.
09TOV capability curve
The arrester boundary of withstand voltage versus duration — higher voltage, shorter time.
10Clearing time
The interval from fault inception to the protection isolating the fault; sets the TOV duration.
11Equivalent clearing time
A fixed assumed delay used in place of a full relay model for survival screening.
12TOV monitoring function
A check that compares the simulated event against the capability curve and reports survival.

Section 1

From model structure to a real application

A temporary-overvoltage analysis is not primarily about how much fault current flows; it is about how high a voltage the equipment sees and for how long. A detailed park model — with its feeders, earthing, converters, transformer and protection — is what makes this kind of internal-fault behaviour, which is hard to capture with simple hand rules, observable directly.

A survival study, not a current study

The headline question is not “what is the fault current?” but “can the surge arresters survive the temporary overvoltage until the protection clears the fault?” That reframing drives every modelling choice below.

Section 2

The case: an internal feeder fault

The fault is not out on the transmission system; it is inside the collector system of the plant. Because the model represents individual feeders and converter units, the internal fault behaviour of the park can be studied on its own terms — and that matters, because an internal fault can produce voltage behaviour quite different from an external grid fault. The park feeds up through the collector network to the wind-power-plant transformer and the point of common coupling, and a fault on one feeder stresses everything connected to the same collector busbar.

Section 3

The fault that matters: single-line-to-ground

The dangerous case for TOV inside a collector system is the single-line-to-ground (SLG) fault. The reason is counter-intuitive at first: for an SLG fault the faulted-phase voltage collapses, but the two healthy phases can rise above their normal phase-to-earth voltage. So the real risk is often not the faulted phase at all — it is the overvoltage stress imposed on the unfaulted phases, and on the arresters protecting them. That is exactly where the study focuses.

Section 4

Why the healthy phases overvolt

When one phase faults to earth, the system neutral is displaced, and that neutral shift lifts the phase-to-earth voltage of the other two phases. How far they rise is summarised by the earth-fault factor — the ratio of the highest healthy-phase voltage during the fault to its nominal value:

\[ k = \frac{V_{\phi e,\max}^{\text{healthy}}}{V_{\phi e,\text{nom}}}, \qquad k \approx \begin{cases} \le 1.4, & \text{effectively earthed } (X_0/X_1 \le 3,\ R_0/X_1 \le 1) \\ \to \sqrt{3}\approx 1.73, & \text{isolated / resonant earthed} \end{cases} \]
\(k\)
earth-fault factor
\(V_{\phi e,\max}^{\text{healthy}}\)
highest healthy-phase-to-earth voltage during the fault
\(V_{\phi e,\text{nom}}\)
nominal (pre-fault) phase-to-earth voltage
\(X_0/X_1\)
zero- to positive-sequence reactance ratio of the network at the fault

The same voltage basis must be used for both terms — normally phase-to-earth RMS, unless the study explicitly uses peak quantities. The values shown are indicative, not universal: the healthy-phase rise is governed by the zero-to-positive-sequence impedance ratio — that is, by the network zero-sequence path, the earthing impedance, the cable capacitance and the fault location — so it is not a fixed textbook constant, and an EMT model is needed to pin it down for a given collector system.

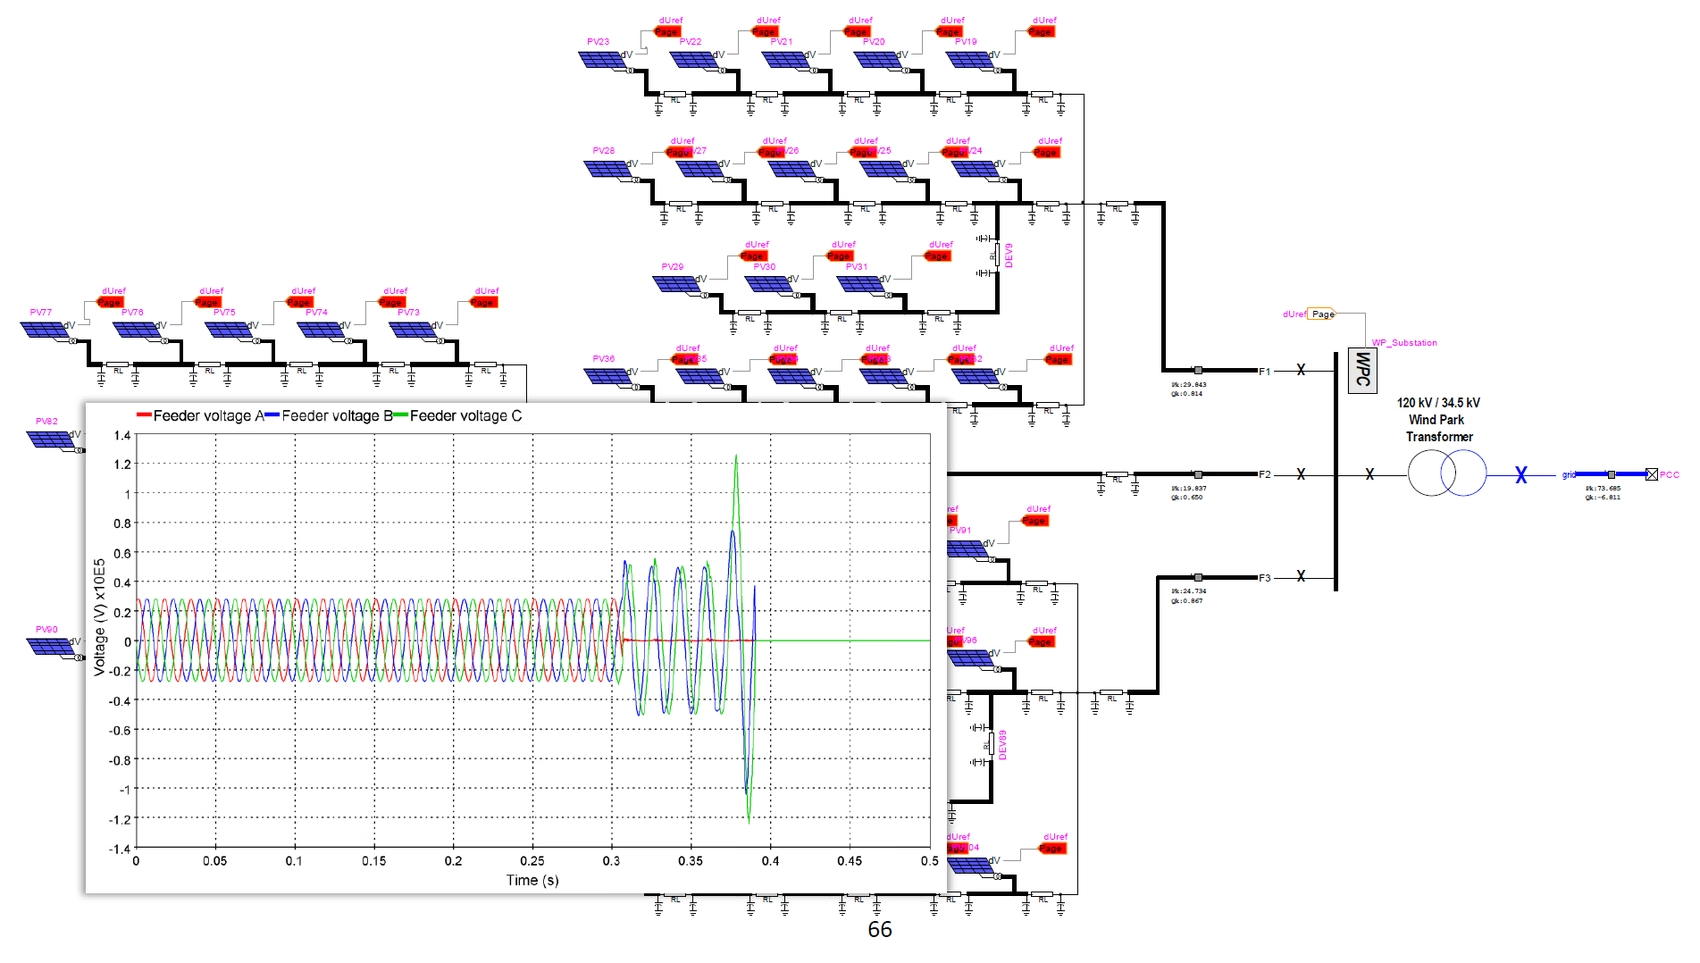
Feeder phase voltages through an internal single-line-to-ground fault, shown on the renewable collector-system single-line model: the PV feeders gather through the 120 kV / 34.5 kV wind-park transformer to the PCC, and the three feeder phase-to-earth voltages are balanced before the fault at about 0.3 s, after which the faulted phase collapses to zero and the two healthy phases swell well above their normal peak until the fault is cleared.
Figure 1 — Feeder phase voltages through the single-line-to-ground event, on the collector-system model: balanced before the fault, the faulted phase collapsing and the healthy phases rising above normal until the protection clears. Both the peak and the duration set the arrester duty.

Section 5

Earthing sets the overvoltage

Because the earth-fault factor is decided by the zero-sequence behaviour, the earthing of the collector grid is the single most important factor. It controls how zero-sequence current flows, how much the neutral shifts, and therefore how high the healthy phase-to-earth voltages climb. Two collector systems with identical converters but different earthing can show very different TOV behaviour. A TOV study must therefore use the actual collector-grid earthing arrangement; a generic earthing assumption can give the wrong arrester duty.

Table 1 — Earth-fault factor and healthy-phase TOV by collector earthing.
Collector EarthingZero-Sequence BehaviourEarth-fault factor \(k\)Healthy-Phase TOV
Solidly / effectively earthedLow \(X_0/X_1\)\(\le 1.4\)Limited
Impedance earthedModerate \(X_0/X_1\)\(1.4\) to \(\approx 1.73\)Elevated
Isolated / resonant (Petersen)Very high \(X_0\)\(\to \sqrt{3}\) or moreSevere and sustained

Section 6

Why converters matter in a TOV study

In a traditional passive network, TOV is set by the earthing, the capacitances, the system strength and the fault type. A renewable collector system adds another actor: the converters are active, controlled devices. The earthing and zero-sequence network behaviour usually set the basic overvoltage mechanism; the converter control, current limits and sequence behaviour then modify the voltage profile and its duration. The decisive detail is the converter current limit: once a converter reaches its limit, its control priorities can change — reactive-current support, active-current reduction, negative-sequence response and protection behaviour may no longer follow the pre-fault control objective — and that changes the resulting healthy-phase voltages. This is why a TOV study in a renewable park needs the converter model, not the passive network alone.

Section 7

The real objective: arrester survival

With the overvoltage understood, the actual challenge is to make sure the surge arresters survive it before the protection trips. The arrester is checked by comparing the simulated voltage–time stress against the manufacturer’s TOV capability curve over the complete fault duration. The question is not simply “what is the peak voltage?” but “what voltage is applied, and for how long?” An arrester can withstand the temporary overvoltage only if the combination of magnitude and duration stays within its capability:

\[ \text{survive} \iff v_{tov}(t) \le V_{cap}(t - t_0) \quad \text{for all } t \in [\,t_0,\ t_{clr}\,] \]
\(v_{tov}(t)\)
applied temporary overvoltage at the arrester
\(V_{cap}(\cdot)\)
arrester TOV capability — withstand voltage as a (decreasing) function of duration
\(t_0,\ t_{clr}\)
fault inception and clearing instants

The arrester survives only if the applied overvoltage stays below its capability for the whole fault duration. A higher overvoltage is tolerable for a shorter time, and even a moderate overvoltage becomes dangerous if it lasts too long — so TOV is a voltage-and-duration problem.

Magnitude and duration together

TOV duty is the pair (how high, how long). Neither alone tells you whether the arrester survives — you compare the event against the capability curve, which trades voltage off against time.

Section 8

The arrester TOV capability curve

A surge arrester is installed to protect insulation against overvoltages, but it is not infinitely strong: it has a TOV withstand characteristic. On that curve the vertical axis is voltage and the horizontal axis is time, and the line slopes downward — for a higher overvoltage the arrester survives only a shorter time; for a lower overvoltage, longer. The curve therefore acts as a boundary: an operating point below the curve means the arrester survives, while a point above it means the arrester may fail or be overstressed. Assessing TOV duty is, in effect, plotting the simulated event against this boundary. One practical caution: the capability curve is usually given in per unit of a defined base — the continuous operating voltage \(U_c\) (or MCOV) or the rated voltage \(U_r\) — so the simulated voltage and the arrester capability curve must be converted to the same voltage base before they are compared.

Section 9

Why clearing time is decisive

The fault is not removed instantly. There is always a delay made up of relay detection, protection logic, breaker operation, and sometimes earthing-switch action or directional/feeder discrimination — so the clearing time is \(t_{clr}-t_0 = t_{detect}+t_{logic}+t_{breaker}+\dots\). This is what sets the duration on the capability curve. Even a high overvoltage may be survivable if the protection clears fast enough; equally, a moderate overvoltage can become dangerous if clearing is slow. The whole study is, at heart, a voltage–time co-ordination problem between the fault and the protection that ends it.

Section 10

Modelling the protection

Because clearing time matters so much, it has to be represented — and there are two valid ways to do it, chosen by how much detail the study needs:

Table 2 — Two ways to represent the protection clearing time.
ApproachWhat You ModelClearing TimeWhen to Use
Equivalent clearing timeA fixed, assumed clearing time (e.g. a set number of cycles)AssumedScreening — arrester survival
Detailed relay modelRelay logic, breaker operating time and co-ordination represented explicitlyComputed by the modelFinal protection-co-ordination studies

The simplified timing is often enough when the objective is survival screening; the detailed relay model is more realistic but more complex, and lets the EMT model itself determine the actual clearing time and the resulting protection behaviour.

Section 11

The TOV monitoring check

Rather than leave the engineer to eyeball waveforms, a monitoring function watches the event against the arrester’s TOV capability curve and reports whether the arrester is overstressed. It tracks what overvoltage the arrester sees, how long it sees it, and whether that operating point crosses the withstand boundary. So the model is doing a practical insulation-and-protection check, not just plotting voltages: it judges whether the arrester duty is acceptable — a withstand verification rather than a waveform inspection. That is exactly what real project studies need.

Section 12

The study workflow

The study can be reduced to five practical steps:

  • Model the collector system — feeders, earthing, converters, transformer and protection timing.
  • Apply the feeder single-line-to-ground fault.
  • Monitor the phase-to-earth voltages and the converter current limits through the event.
  • Determine the clearing duration — how long the overvoltage lasts until the protection clears.
  • Compare the arrester duty against its TOV capability curve.
Four things, considered together

Earthing, converter limits, relay timing and the arrester TOV curve all enter the answer. TOV assessment is not a peak-voltage calculation — it is a combined voltage, duration and clearing-time problem.

Section 13

Key points

TOV is voltage and duration, judged against the arrester curve

  1. SLG faults raise the healthy phase-to-earth voltages. A single-line-to-ground fault collapses the faulted phase but lifts the two healthy phases, by an earth-fault factor \(k\).

  2. Collector earthing controls the zero-sequence path. It sets the neutral shift and so how high the healthy phases climb — use the actual earthing, not a generic assumption.

  3. Converter current limits can modify the voltage profile. Once a converter reaches its limit its sequence and voltage-support behaviour changes, so the converter model is needed, not the passive network alone.

  4. Arrester duty is voltage and duration. Survival is judged by comparing the simulated voltage–time stress against the arrester TOV capability curve, on a common voltage base.

  5. Protection clearing time is part of the insulation assessment. It sets the TOV duration — an equivalent delay for screening, a detailed relay model for final protection studies.

For the surrounding context, see the park modelling, types of overvoltage and temporary-overvoltage sources guides.

References

References

  1. EMTP® Documentation and Application Notes. Powersys / EMTP®.
Built on EMTP® · Expert spotlight
Portrait of Henry Gras, Chief Operating Officer of PGSTech

Henry Gras

Chief Operating Officer, PGSTech · Montréal, Canada

Henry Gras delivers the EMTP® University course “EMT Simulation and Analysis of Large-Scale Power Systems with Renewables” and works daily with the tool this article is written around.

Henry is based in Montréal, where he is Chief Operating Officer of PGSTech, the company responsible for EMTP® engineering services, commercialisation and continuing software development. He holds a master’s degree from Polytechnique Montréal, where he worked on electrical-machine research, and previously completed an engineering degree at École Centrale de Lyon in France.

Readers who want a structured programme on EMT simulation of large-scale power systems with renewables will find his EMTP® University course an excellent next step.

Henry’s technical expertise covers electromagnetic transient simulation, renewable-energy integration, power-system modelling, electrical machines, protection and specialist transient studies including TRV, transformer energisation, ferroresonance, insulation coordination and power quality.

Thirty-Part Technical Series

EMTP® Renewable Energy Modelling

A thirty-part guide to modelling wind, PV and full-converter plant in EMTP® — sources and turbines, converter and plant control, sequence control under faults, protection, and weak-grid and SSCI stability.

Part 21 Reading now

TOV Analysis for a Collector-Feeder Fault

Healthy-phase overvoltage from a collector-feeder fault, earthing, and arrester energy survival.

Series progress 21 of 30