Switching Surges · Insulation Coordination

Dielectric Strength of Overhead-Line Insulation under Switching Surges

Switching surges matter in transmission-line design because they produce slow-front overvoltages whose time-to-crest can be critical for external insulation. For some line clearances — especially under positive polarity — the switching-surge withstand can be lower than both the lightning-impulse and the power-frequency strength, which is why switching surges can control the insulation design of HV and EHV lines. Crucially, switching-surge strength is not governed by voltage magnitude alone: it depends on strike distance, insulator arrangement, tower and crossarm geometry, conductor position, waveform shape and time-to-crest, polarity, whether the stress is phase-to-ground or phase-to-phase, and the weather. This guide works through each of those factors, the CFO and gap-factor formulas for first estimates, and the statistical comparison that detailed design actually rests on.

Reading time ≈ 28 min · Switching-surge insulation guide

The discharge physics behind a flashover — corona, streamers and leaders — and how to model the air gap itself in a transient program are covered in the APS note on air-gap modelling in EMTP®. This page is about the other half of the problem: how strong the external insulation actually is under a switching surge, what governs that strength, and how it is compared with the switching overvoltage the network produces. Switching-surge insulation assessment should not be reduced to a single fixed-voltage check unless the assumptions behind that check are stated explicitly.

Abbreviations used on this page
CFOCritical flashover voltage (50% probability, U₅₀)
BSL / BILBasic switching / lightning impulse insulation level
\(k_g\)Gap factor (relative to a rod-plane gap)
\(S\)Strike distance / gap spacing, m
CWFCritical wavefront (time-to-crest of minimum strength)
\(\sigma_f\)Standard deviation of flashover voltage
\(E_2\)Statistical (2%) switching overvoltage
\(V_3\)Insulation strength 3\(\sigma\) below CFO
EMTP®Electromagnetic Transients Program
puPer unit (of crest phase-to-ground voltage)
Key idea
  1. Switching strength is not magnitude alone. It depends on the waveform — time-to-crest, active-front duration and polarity — and on strike distance, geometry, phase position, wet/dry condition and the statistical distribution.
  2. Positive-polarity slow-front surges can be the design-controlling stress on EHV/UHV lines: switching strength rises less than proportionally with spacing and can fall below the lightning-impulse strength.
  3. There is a critical wavefront (the U-curve minimum): a longer or shorter wave is not automatically more or less severe — severity depends on the waveform–geometry relationship.
  4. Compare a statistical strength \(V_3=\mathrm{CFO}(1-3\sigma)\) with a statistical overvoltage \(E_2\), not peak-vs-peak — and extract phase-to-phase stress separately, since its worst case need not coincide with the worst phase-to-ground.
Key terms used on this page
01Switching surge
A slow-front overvoltage produced by a network switching event (energisation, reclosing, switching of reactive plant).
02Critical flashover voltage (CFO)
The crest voltage giving a 50% probability of flashover for a given gap, waveform, polarity and weather.
03Gap factor \(k_g\)
The ratio of a configuration’s flashover voltage to that of the reference rod-plane gap (\(k_g=1\)).
04Strike distance \(S\)
The shortest effective air path across which flashover can occur — not necessarily the insulator-string length.
05Active front
The part of the impulse from ~70% of crest to crest, where the flashover process essentially takes place.
06U-curve / critical wavefront
CFO plotted against time-to-crest passes through a minimum; the time-to-crest of that minimum is the critical wavefront.
07Standard deviation \(\sigma_f\)
The scatter of flashover voltage about CFO; often given as a per-unit coefficient of variation \(\sigma_f/\mathrm{CFO}\).
08Statistical overvoltage \(E_2\)
The switching overvoltage level exceeded by only 2% of operations (the 2% value).
09Phase-to-phase factor \(\alpha\)
\(\alpha=V_-/V_{\text{tot}}\); the share of the total phase-to-phase voltage carried by the negative component.
10Trapped charge
Residual charge left on a de-energised line; it raises reclosing overvoltages.
11Slow-front overvoltage
An overvoltage with a long time-to-crest (tens of µs to ms), the switching-surge class in IEC 60071.
12Pre-insertion resistor
A breaker resistor inserted briefly before the main contacts close, to damp the energisation transient.

Section 1

Why switching surges can control insulation design

On extra-high-voltage and ultra-high-voltage lines the external insulation is most often determined by switching-overvoltage requirements, and only rarely by lightning. The reason is geometric and physical: for the long, non-uniform air gaps of EHV/UHV towers, the positive-polarity switching strength rises less than proportionally with gap spacing, so it saturates — while lightning strength keeps rising roughly linearly. Beyond a certain clearance the slow-front switching withstand becomes the lowest of the three stresses (switching, lightning, power-frequency), so it sets the required strike distance. Insulation designed for switching is usually also adequate for power frequency in clean, wet conditions; contamination is then handled separately. The practical message is that switching strength must be assessed on its own terms, not inferred from a lightning or power-frequency figure.

Section 2

How switching surges differ from lightning

Lightning surges are fast-front events whose stress is dominated by front steepness, travelling waves, and tower and footing response. Switching surges are slow-front events whose time-to-crest ranges from tens of microseconds to several milliseconds depending on the system and the operation — line energisation, reclosing, trapped charge, load rejection, capacitor-bank or shunt-reactor switching, transformer energisation and long-line operations. The waveform is produced by the network itself, so in a transient study the priority is to model the switching event correctly rather than to impose a standard impulse. The standard switching impulse, written 250/2500 µs (250 µs time-to-crest, 2500 µs time-to-half), is a useful withstand and insulation-coordination reference, but real system surges can be oscillatory, multi-peaked and have phase-to-phase components. (The choice of waveform for the transient itself is discussed on the lightning & switching waveform page.)

Section 3

The main factors affecting switching strength

The variables fall into three groups:

  • Geometrical — strike distance (air clearance), insulator-string arrangement (V-, I- or strain string), tower shape and size, crossarm geometry, conductor position, phase location, I-string swing angle, number of insulator units.
  • Electrical — waveshape, time-to-crest, time-to-half, polarity, phase-to-ground vs phase-to-phase stress, trapped charge, system overvoltage level.
  • Meteorological — relative air density, humidity, rain, wind and surface wetting.

Geometry sets the electric-field distribution; the waveform sets how the discharge develops in time; weather modifies the external-insulation strength. A reliable assessment considers all three.

Section 4

Waveform shape and the active front

Switching waveshapes are almost infinitely varied, and the insulation strength depends particularly on the time-to-crest — for a given geometry the CFO is not constant as the front changes. The early, low-voltage part of the wave has little influence; the discharge essentially develops in the active part of the front, conventionally taken as the portion between about 70% of crest and the crest (leader inception and propagation occur between roughly 60–75% and 100% of crest for a 50%-flashover impulse). Two surges with different total time-to-crest can give similar stress if their active-front times match; conversely, two waves with the same peak can perform differently if their active fronts differ.

Practical conclusion

Do not assess switching-surge insulation by peak voltage alone. The waveform near the crest — the active-front duration and the time spent at high voltage — is part of the stress.

Section 5

The U-curve and critical wavefront

For a fixed strike distance, the switching flashover voltage plotted against time-to-crest passes through a minimum — the so-called U-curve. The time-to-crest at that minimum is the critical wavefront (critical time-to-crest), often of the order of a few hundred microseconds for practical line clearances — but it depends on spacing and geometry, not a fixed value. There is a different U-curve for each spacing, and the minimum shifts to larger times-to-crest as the spacing increases. Real switching surges have times-to-crest spanning roughly 50–2000 µs. For wavefronts shorter than critical, flashover tends to occur after crest, so the time-to-half also influences strength.

Why this needs care

A longer waveform is not automatically more severe, and a shorter one is not automatically less severe. Severity depends on where the actual time-to-crest sits relative to the critical wavefront for that geometry — so the controlling case must be found from the simulated overvoltage distribution, not assumed.

Section 6

Polarity effect

Polarity strongly affects switching strength. For most practical phase-to-ground configurations the energised electrode (conductor or hardware) is much smaller than the grounded tower or earth plane, so the field is highly non-uniform with the highest intensity at the energised electrode. Under positive polarity the discharge develops more readily in such a field, so the flashover voltage is lower — the more non-uniform the field, the more pronounced the effect. Phase-to-ground insulation designed to withstand positive-polarity surges is then minimally affected by negative-polarity ones, so it is common practice to design phase-to-ground insulation on the positive-polarity surge and effectively disregard negative-polarity switching surges (after confirming against the applicable standard and the actual geometry).

Section 7

Geometry and the controlling strike distance

Geometry has a major effect: conductor-to-crossarm, conductor-to-tower-side and conductor-to-upper-truss distances, insulator-string length and type, V-/I-/strain arrangement, tower-window geometry and conductor height all matter. The presence of large grounded planes (a tower approximating a ground plane) is particularly harmful to positive-polarity strength. The controlling strike distance is the shortest effective path across which flashover can occur — for an outside arm, the smallest of:

\[ S = \min\!\left(S_1,\ S_2,\ \frac{S_I}{1.05}\right) \]
\(S_1\)
conductor to the upper tower / truss
\(S_2\)
conductor to the tower side
\(S_I\)
insulator-string length

The \(S_I/1.05\) term reflects that wet insulator-string behaviour differs from a pure air clearance, so the string length is divided by a factor (~1.05) before comparison. The insulation should be assessed on the actual controlling strike distance, not the nominal string length; in practice the insulator-string length is the design control variable.

Section 8

Insulator length versus strike distance

In dry conditions, increasing the insulator-string length raises the CFO until the string length roughly equals the controlling strike distance. If the string is shorter than the surrounding air clearance, flashover tends to occur across the string (the string limits the strength); if the air clearance is shorter than the string, the air clearance becomes controlling. In wet conditions the saturation point shifts so that the string length should be about 1.05–1.10× the strike distance — i.e. the insulator string should be about 5–10% longer than the air strike distance to obtain the maximum CFO within the tower window. A long insulator string alone does not guarantee adequate switching performance if the conductor-to-structure clearance is shorter, so string length, tower-window dimensions, crossarm clearance and the expected switching stress must be coordinated together.

Section 9

Phase position

Phase position influences strength because the grounded structure around each phase differs. With V-strings, the outside phase CFO is typically about 8% higher than the centre phase, because the outside phase “sees” only one tower side. The centre phase can therefore be the more critical one in some tower-window arrangements. A switching assessment should not assume all phases have identical insulation strength — the geometry around each phase should be checked, and both the highest calculated overvoltage and the weakest insulation geometry considered.

Section 10

Weather and atmospheric conditions

External-insulation strength depends on relative air density, absolute humidity, rain, wind and surface wetting. Air density and humidity change flashover strength and call for standard atmospheric correction. Rain reduces the switching strength of insulator strings — but does not affect a pure air clearance. Wet tests are also more variable than dry, because water distribution along a vertical string is uneven (a V-string at ~45° sheds water more consistently). For the design condition (string length 1.05–1.10× the strike distance), wet conditions reduce the dry CFO; a typical reduction of about 4% is suggested where supported by the design method.

Validity caveat

A switching-surge strength value is valid only for its assumed atmospheric condition, wet/dry state, polarity, waveform and geometry. Quoting a CFO without those conditions is meaningless.

Section 11

The gap factor

The gap factor \(k_g\) relates the flashover strength of a real configuration to a reference. The rod-plane gap is the reference because it has the lowest strength, so \(k_g=1\) for rod-plane and \(k_g>1\) for stronger configurations. The gap factor is not a universal constant — it varies with tower shape, conductor position, structure width, height above ground, strike distance and even waveshape. The values below are indicative screening ranges, not final design values:

Table 1 — Typical positive-polarity switching gap factors \(k_g\) (Paris et al. / Gallet, CIGRE TB 72). The rod-plane gap is the reference, \(k_g=1\).
Electrode ConfigurationGap factor \(k_g\)
Rod–plane (reference)1.00
Rod–structure1.05
Conductor–plane1.10–1.15
Conductor–window~1.25
Rod–rod / conductor–structure~1.30
Conductor–crossarm (lateral / lower structure)~1.45
Conductor–rod1.65 (h=3 m) to 1.90 (h=6 m)

These are useful for screening, but final values should be checked against the applicable standard (CIGRE TB 72, IEC 60071-2), test data or a detailed insulation-coordination method — the gap factor of an actual tower configuration is computed from geometry-specific expressions, not read off as a single number.

Section 12

Simplified CFO estimation

For preliminary assessment the CFO can be estimated from simplified positive-polarity, dry expressions. The Paris–Cortina form (a 250 µs front) is:

\[ \mathrm{CFO} = 500\,k_g\,S^{0.6} \]
\(\mathrm{CFO}\)
critical (50%) flashover voltage, kV crest
\(k_g\)
gap factor
\(S\)
strike distance, m

It uses a 250 µs front, which is not the critical wavefront at every spacing, so it does not give the minimum strength. IEC 60071-2 adopts the same \(500\,k_g\,S^{0.6}\) as a good approximation for standard switching impulses.

For the critical wavefront (minimum strength), Gallet’s expression is used:

\[ \mathrm{CFO} = \frac{3400\,k_g}{1 + 8/S} \]
\(\mathrm{CFO}\)
critical (50%) flashover voltage, kV crest
\(k_g\)
gap factor
\(S\)
strike distance, m

Valid for positive polarity and dry conditions, to gap spacings of roughly 15 m. As \(S\to\infty\) the rod-plane CFO approaches \(3400\,k_g\) kV (which is why it should not be pushed to arbitrarily large gaps). Note the \(k_g\) multiplies the 3400 and the \(8/S\) term uses the bare spacing \(S\) — it is not \(3400/(1+8/(k_gS))\), a common mis-write that gives different numbers. Inverting it gives the strike distance for a target CFO: \(S = 8\big/\!\left(\tfrac{3400\,k_g}{\mathrm{CFO}}-1\right)\) — the same Gallet expression rearranged, so it carries the same positive-polarity, dry, ~15 m validity limits.

For rod-plane gaps up to about 25 m, IEC 60071-2 also gives:

\[ \mathrm{CFO} = 1080\,k_g\,\ln(0.46\,S + 1) \]
\(\mathrm{CFO}\)
critical (50%) flashover voltage, kV crest
\(k_g\)
gap factor
\(S\)
strike distance, m

Positive-polarity CFO in kV crest, \(S\) in m, at sea level. These formulas are first estimates for conceptual checks — they do not replace a full insulation-coordination assessment where waveform, the statistical overvoltage distribution, geometry, altitude, humidity and wet/dry state matter.

Section 13

The statistical nature of strength

Insulation strength is statistical. It is described by the CFO (the 50%-flashover voltage) and a standard deviation \(\sigma_f\), with the strength characteristic approximated by a cumulative normal (Gaussian) distribution. For non-uniform gaps and waveshapes near the critical wavefront the coefficient of variation \(\sigma_f/\mathrm{CFO}\) is about 4–5% of CFO (around 4.3% dry, 4.9% wet in the reference data; 5% is commonly used for both). This ratio is broadly constant across practical strike distances — it is the absolute \(\sigma_f\) that grows as CFO grows. The Gaussian strength distribution is often truncated at an absolute minimum of about 4\(\sigma\) below CFO, which is distinct from the 3\(\sigma\) design level \(V_3\) used below. This statistical character is why detailed design compares a statistical strength with a statistical overvoltage, rather than a single peak with a single withstand number.

Section 14

Statistical overvoltage and the design check

The switching overvoltage is itself statistical — it depends on breaker closing instant, pole scatter, trapped charge, system condition, source strength and line configuration. A common characterising level is the 2% value \(E_2\), the overvoltage exceeded by only 2% of operations. For an approximately normal distribution:

\[ E_2 = \mu_S + 2.054\,\sigma_S \]
\(E_2\)
statistical (2%) switching overvoltage
\(\mu_S\)
mean of the overvoltage distribution
\(\sigma_S\)
standard deviation of the overvoltage distribution

\(2.054\) is the one-sided normal deviate for the 98th percentile (2% exceedance). The insulation strength used for comparison is taken a chosen number of standard deviations below CFO — for a conservative comparison, three:

\[ V_3 = \mathrm{CFO} - 3\sigma_f = \mathrm{CFO}\,(1 - 3\sigma),\qquad \sigma=\frac{\sigma_f}{\mathrm{CFO}} \]
\(V_3\)
insulation strength 3\(\sigma\) below CFO
\(\sigma\)
standard deviation in per unit of CFO

The design criterion then compares the statistical strength with the statistical overvoltage:

\[ V_3 \;\geq\; E_2 \]

i.e. the selected insulation strength (3\(\sigma\) below CFO) should be at least the 2% statistical overvoltage. This is a simplified (deterministic-statistical) coordination check — it compares the 2% stress \(E_2\) with a low strength quantile \(V_3\). The true risk of failure is the convolution of the stress and strength distributions and is generally lower than the 2% reference, not literally 1 in 100; the accepted risk and any additional margins (coordination and atmospheric factors) follow the design standard, e.g. IEC 60071-2.

Section 15

Worked example: a 400 kV strike distance

To select the insulator striking distance of a 400 kV line (after Martínez-Velasco, Example 2.5), the three switching scenarios — energisation, reclosing and reclosing with pre-insertion resistors — are simulated statistically. Reclosing with trapped charge is the most onerous, giving a 2% statistical phase-to-ground overvoltage \(E_2\approx4.558\) pu (read from the assumed switching-overvoltage distribution; the high value reflects line trapped charge). With the phase-to-ground crest base \(400\sqrt{2}/\sqrt{3}=326.6\) kV:

Step-by-step (reclosing case, \(\sigma=5\%\), \(k_g=1.45\))

\(E_2 = 4.558 \times 326.6 \approx 1488.6\) kV crest. Setting \(V_3=E_2\) and inverting \(V_3=\mathrm{CFO}(1-3\sigma)\): \(\mathrm{CFO}=1488.6/(1-0.15)=1751.3\) kV. Then, from the Gallet inversion, \[ S = \frac{8}{\dfrac{3400\,k_g}{\mathrm{CFO}}-1} = \frac{8}{\dfrac{3400\times1.45}{1751.3}-1}=\frac{8}{1.815}\approx 4.41\ \text{m}. \] This is a long distance for 400 kV (driven by trapped charge); the other scenarios give shorter distances — e.g. energisation alone ~2.3 m — so reclosing without trapped-charge mitigation dominates. Because \(k_g\) itself depends on \(S\), the calculation is iterated; the typical \(k_g=1.45\) is used first and refined. This \(S\) is the switching-surge requirement only, at standard atmosphere with a coordination factor of 1; the final striking and creepage distance is the maximum of the switching, lightning, pollution and power-frequency requirements, with altitude (atmospheric) correction per IEC 60071-2.

Section 16

Phase-to-ground and phase-to-phase stress

Switching surges stress both phase-to-ground and phase-to-phase insulation. Phase-to-ground stress compares each phase to ground or to the tower/structure. Phase-to-phase stress is more complex because it is the instantaneous difference between two phase voltages:

\[ V_{AB}(t) = V_A(t) - V_B(t) \]
\(V_{AB}(t)\)
instantaneous phase-to-phase voltage (A–B)
\(V_A,\ V_B\)
instantaneous phase-to-ground voltages

The phase-to-phase strength is not governed by the total voltage alone but also by how it is shared between the positive and negative phase-to-ground components, characterised by:

\[ \alpha = \frac{V_-}{V_{\text{tot}}} \]
\(\alpha\)
phase-to-phase voltage-sharing factor
\(V_-\)
negative-component phase-to-ground voltage at the instant of maximum \(V_{AB}\)
\(V_{\text{tot}}\)
total phase-to-phase voltage

\(\alpha=0.5\) is the symmetrical (equal-and-opposite components) reference condition used to characterise the phase-to-phase strength; the governing service case is where the actual stress — usually positive-component-dominated, \(\alpha<0.5\) — meets the strength curve, so \(\alpha=0.5\) is not automatically the worst case. The time-to-crest of the positive component matters: minimum flashover voltages for rod-rod phase-to-phase gaps occur for times-to-crest of about 150–300 µs (conductor-to-conductor gaps are less sensitive). Only the highest phase-to-phase peak need be considered; subsequent peaks of similar magnitude change the strength little.

Practical point

For phase-to-phase studies, collect the actual maximum phase-to-phase voltage from the time-domain simulation — its worst case need not coincide with the highest phase-to-ground voltage on either phase.

Section 17

Energisation, reclosing and trapped charge

Switching overvoltages depend strongly on the scenario. Line energisation can produce significant overvoltages at the open end through travelling-wave reflection and multimodal propagation (often above 2 pu). Reclosing is usually more severe when trapped charge remains: a charge of about 1 pu on the unfaulted phases can push open-end voltages above 3 pu when the line is re-energised. Pre-insertion resistors or controlled (point-on-wave) switching reduce these overvoltages by damping or timing the energisation transient. A switching assessment should therefore consider several cases — normal energisation, reclosing with trapped charge, reclosing with pre-insertion resistor, controlled switching and project-specific conditions — because the controlling case is not always the obvious one and must be identified from simulation.

Section 18

Practical EMTP® assessment workflow

A practical switching-surge assessment runs:

  • Define the switching cases — energisation, reclosing, trapped charge, shunt-reactor and capacitor switching, transformer energisation.
  • Build the EMTP® model — source equivalent, line model, breaker timing and pole scatter, trapped charge, surge arresters, shunt compensation, transformer saturation where relevant, and any mitigation device.
  • Run enough operations — a statistical (Monte-Carlo) set of switching instants to build a meaningful overvoltage distribution where a statistical assessment is required.
  • Extract the relevant stresses — phase-to-ground, phase-to-phase, conductor-to-crossarm or conductor-to-tower voltage, depending on the design question.
  • Determine the strength — CFO, gap factor, strike distance, atmospheric correction, wet/dry state and standard deviation.
  • Compare — the statistical overvoltage (\(E_2\)) against the statistical strength (\(V_3\)).
  • Mitigate if short — closing/pre-insertion resistors, controlled switching, surge arresters, increased clearance or a revised insulation configuration.

Section 19

When simplified formulas are enough

Simplified CFO formulas are useful for initial design estimates, checking whether switching may control the design, selecting an approximate strike distance, screening tower-window arrangements, and explaining the influence of gap factor and strike distance.

When they are not enough

They should not be the sole basis for final design when the tower geometry is unusual, phase-to-phase stress is important, the site has non-standard atmospheric conditions, wet performance is critical, the waveform is strongly non-standard, or the overvoltage is assessed statistically. For detailed design, simulate the switching transient and evaluate strength with the applicable standard, test data or an accepted insulation-coordination method.

Section 20

Main takeaway

Switching-surge insulation strength is controlled by far more than peak voltage — the waveform time-to-crest and active-front duration, polarity, strike distance, tower geometry, phase position, wet/dry condition and the statistical overvoltage distribution all shape the result. For preliminary work, the gap-factor and CFO formulas give useful first estimates; for detailed design, the switching event is simulated, the actual phase-to-ground and phase-to-phase overvoltages are extracted, and the strength is assessed with the relevant standard.

Suggested report wording

“The switching-surge assessment considered the waveform, polarity, geometry and statistical nature of the overvoltage. The switching overvoltage was obtained from the transient network model rather than imposed as a fixed standard waveform, and compared with the applicable external-insulation strength (strike distance, gap factor, wet/dry condition and atmospheric assumptions). Phase-to-ground assessment used the controlling conductor-to-structure voltage; phase-to-phase assessment evaluated the instantaneous voltage difference, since its worst case need not coincide with the highest phase-to-ground voltage. Simplified CFO expressions were used for preliminary strike-distance screening, with final assessment based on the statistical overvoltage and the actual geometry. Where the margin was short, mitigation (controlled switching, pre-insertion resistors, surge arresters or increased clearance) was considered.”

Engineering conclusion

Do not force a standard switching impulse into every study. Model the switching event, compute the actual overvoltage waveform, and compare it with an insulation-strength model that matches the geometry, polarity, waveform and environment.

References

References

The standards, technical brochures, key papers and reference works behind this page.

  1. A. R. Hileman, Insulation Coordination for Power Systems. New York, NY, USA: Marcel Dekker, 1999.
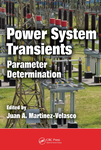
  2. J. A. Martinez-Velasco, Ed., Power System Transients: Parameter Determination. Boca Raton, FL, USA: CRC Press, 2010.
  3. IEC 60071-1:2019, Insulation Co-ordination – Part 1: Definitions, Principles and Rules. Geneva, Switzerland: International Electrotechnical Commission, 2019.
  4. IEC 60071-2:2023, Insulation Co-ordination – Part 2: Application Guidelines. Geneva, Switzerland: International Electrotechnical Commission, 2023.
  5. CIGRE Working Group 33.07, Guidelines for the Evaluation of the Dielectric Strength of External Insulation, Technical Brochure 72. Paris, France: CIGRE, 1992.
  6. IEEE Std 1313.2-1999, IEEE Guide for the Application of Insulation Coordination. New York, NY, USA: IEEE, 1999.

Sixteen-Part Technical Series

EMTP® Line, Cable & Lightning Modelling

A sixteen-part guide spanning line and cable modelling, overhead-line physics, lightning, and the dielectric strength of external insulation.

Part 15 Reading now

Switching-Surge Insulation Strength

The active front, U-curve, gap factor and CFO formulas, and the statistical strength-vs-overvoltage design check.

Series progress 15 of 16